
Helpdesk Metrics Every Small IT Team Should Track (And What to Ignore)
Discover the four core helpdesk metrics small IT teams actually need to track, realistic SLA baselines, and how to stop measuring useless vanity data.
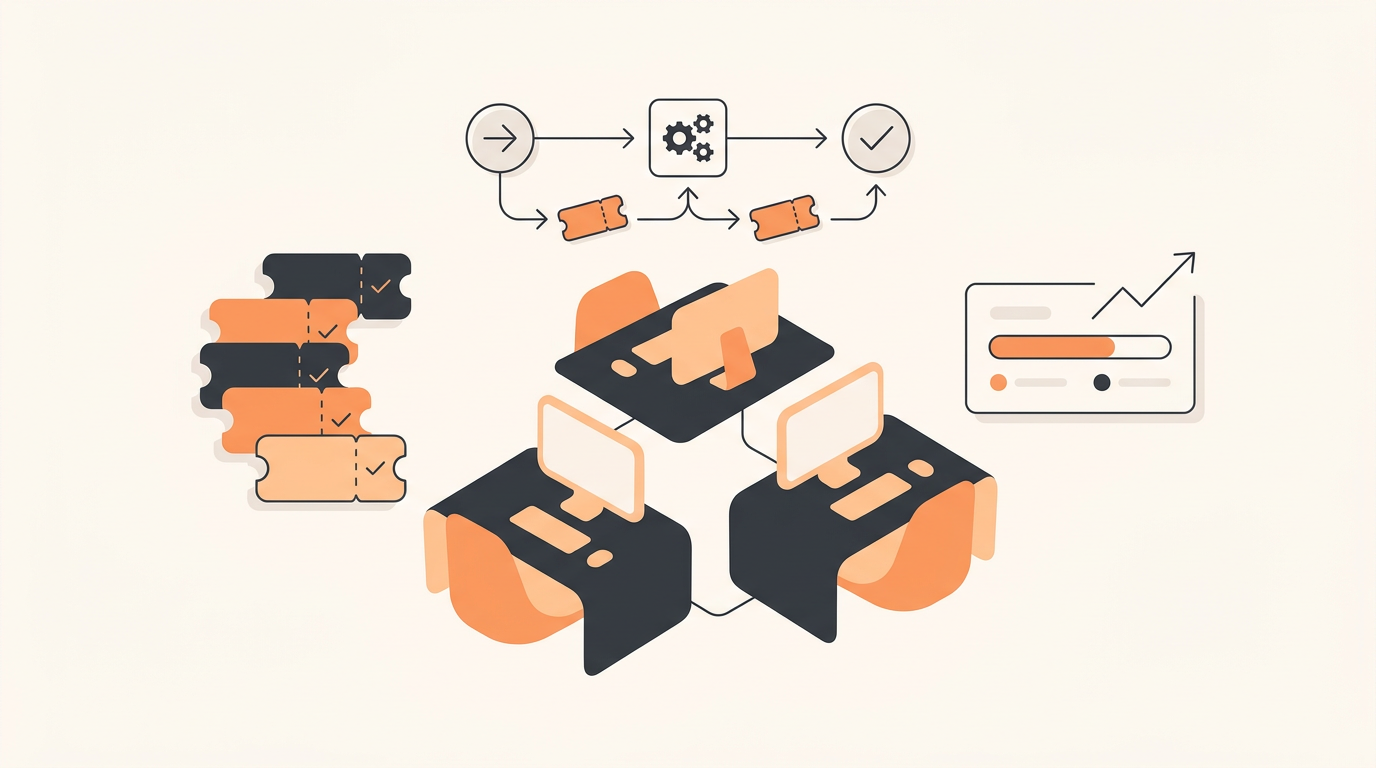
Tracking everything means you understand nothing, especially when your IT team is just two or three people supporting a growing company. A lean internal tech team should monitor exactly four core metrics to gauge success: first response time, average resolution time, customer satisfaction (CSAT), and the ratio of tickets resolved via self-service. Any metric beyond those requires a dedicated operations manager to interpret and action, making them a costly distraction for departments focused on keeping the business running.
The Trap of Enterprise Metrics for Small Teams
When migrating off shared inboxes or messy chat channels, small IT departments often make the mistake of copying the metric frameworks used by massive enterprise service desks. They read ITIL handbooks and suddenly want to track cost-per-ticket, mean time between failures (MTBF), and agent utilization rates. This approach actively harms small teams. When you only have two technicians, agent utilization is always going to be near maximum, and tracking the exact cost of resetting a password takes more time than the reset itself.
Take an illustrative example of a 60-person logistics company migrating off a shared support email address. The IT manager read that they should track root-cause problem identification rates. Because they lacked a dedicated problem manager, technicians spent hours tagging, categorizing, and linking minor incidents in an attempt to generate clean data. The result was a massive backlog. The team spent more time doing data entry than actually fixing printers or provisioning software. Small teams do not need enterprise analytics; they need operational clarity. They need to know if users are getting help fast, if the fixes actually work, and if the team is drowning in repetitive requests.
The Core Metrics You Actually Need to Track
Strip away the noise, and your service desk reporting should center on four fundamental numbers. These metrics dictate the employee experience and highlight exactly where your team needs to improve.
First Response Time (FRT)
First Response Time measures how long a user waits before a human acknowledges their issue. An automated email stating "We received your ticket" does not count. FRT is arguably the most critical metric for internal trust. When an employee submits a request, anxiety builds until they know someone is actively looking at it. A fast FRT reduces duplicate tickets and prevents users from bypassing the queue to tap a technician on the shoulder. For a small team, tracking FRT tells you if your intake and triage process is working.
Average Resolution Time (ART)
Average Resolution Time tracks the total time from ticket creation to final closure. This metric provides a broad view of team efficiency and workload. While some complex issues will take weeks to resolve, the average should remain relatively stable. If you see ART creeping upward week over week, your team is likely blocked by external vendors, missing documentation, or an unmanageable ticket volume. Tracking ART by category (e.g., hardware requests vs. software access) immediately shows you which workflows are bottlenecked.
Customer Satisfaction (CSAT)
Internal IT teams often skip CSAT surveys, assuming they only matter for external customer support. This is a mistake. CSAT measures the human element of your technical support. You can have incredibly fast response and resolution times, but if technicians are closing tickets without confirming the issue is actually fixed, the business suffers. Keep it simple: use a binary "Good/Bad" or a basic thumbs up/down system. High response rates on simple surveys yield better operational data than long, complex questionnaires that no one fills out.
Ticket Deflection Rate
You cannot hire your way out of a growing ticket queue. The deflection rate measures how many potential tickets were resolved without human intervention. This happens through a self-serve Knowledge Base where employees find their own answers, or through a Service Catalog that guides users to the right resources automatically. Tracking this metric proves the return on investment for the time your team spends writing documentation.
Setting Realistic SLA Baselines for Small Companies
Service Level Agreements (SLAs) set expectations for both your team and your end users. Without documented SLAs, everything feels like an emergency. If you are setting up an IT ticketing system for the first time, you need reasonable starting points. Do not promise instantaneous resolution if you cannot guarantee it. Here is a realistic baseline for a small team supporting 20 to 300 employees during standard business hours.
- Urgent (Business completely stopped): 15-minute First Response Time, 4-hour Resolution Time.
- High (Individual blocked from working): 1-hour First Response Time, 8-hour Resolution Time.
- Normal (Standard request or minor issue): 4-hour First Response Time, 2-day Resolution Time.
- Low (Information requests or long-term tasks): 24-hour First Response Time, 5-day Resolution Time.
These numbers give your technicians breathing room. If an employee submits a low-priority request for a non-essential software upgrade, the technician knows they have a full day to acknowledge it, allowing them to focus on the urgent network outage happening right now.
Categorization: The Hidden Prerequisite for Good Data
Metrics mean nothing if the underlying data is garbage. If 80 percent of your tickets are categorized as "General Issue" or "Other," you cannot identify trends. Manual categorization relies on the end-user selecting the correct dropdown or the technician remembering to update the field before closing the ticket. Both methods fail consistently.
Small teams must rely on intelligent intake. When a user submits a request, the system should automatically interpret the text and assign the correct category, urgency, and routing path. Features like QueAssist perform AI-powered ticket triage, categorizing, prioritizing, and routing tickets on arrival. If a user types "I dropped my laptop and the screen is cracked," the system immediately tags it as a hardware incident, sets the priority to high, and routes it to the designated hardware technician. Clean categorization at the point of entry ensures your First Response Time and Average Resolution Time metrics are grouped logically.
A 5-Step Process to Audit and Clean Your Helpdesk Data
If you have been running a service desk for a while and suspect your metrics are inaccurate, you need a baseline reset. Follow this structured process to clean your data and start measuring what matters.
- Standardize your intake channels. Shut down shared inboxes, direct messages to technicians, and walk-ups. Route all users through an Employee portal with a choice of traditional forms or AI chat intake. If a ticket isn't in the system, it doesn't exist.
- Prune your Service Catalog. Review your categories and subcategories. Consolidate them down to no more than 15 broad topics. A browsable menu of pre-approved requests ensures the data is structured from the start.
- Implement automated routing. Configure configurable SLA rules per priority and assignment rules for first-match routing to teams or agents. This prevents tickets from sitting unassigned in a general queue, which artificially inflates your response times.
- Turn on simplified CSAT. Configure a one-click CSAT survey to trigger upon ticket closure. Make it mandatory for the system to ask, but optional for the user to answer.
- Schedule a monthly metric review. Set a recurring calendar invite for the IT team to review the four core metrics. Look for anomalies, such as a sudden spike in ART for hardware requests, and discuss the root cause.
Measuring Self-Service and Agentic Auto-Resolution
As small teams mature, they realize that the best ticket is the one that never gets created. Deflection happens through a well-maintained Knowledge Base, allowing employee self-serve search so common questions never need to become tickets. But modern systems go further than just showing articles.
Agentic auto-resolution completely changes how you measure helpdesk success. When a system can resolve common, well-documented employee requests automatically grounded in the organization's own Knowledge Base, those tickets have a zero-minute resolution time. For example, if an employee requests access to a specific shared drive, the system can verify their department, seek automated approval from their manager, and provision the access via API. You must track these auto-resolved tickets separately. If you blend them into your standard Average Resolution Time, they will artificially lower the average, making your human technicians look faster than they actually are. Track "Human ART" and "Automated ART" as distinct numbers.
Metric Tracking by IT Maturity Stage
Your metric strategy should evolve as your team grows and your processes stabilize. Tracking advanced metrics too early leads to frustration, while tracking basic metrics too late leaves you blind to operational inefficiencies.
| Maturity Stage | Core Focus | Metrics to Track | What to Avoid |
|---|---|---|---|
| Reactive (Just starting) | Gaining control of chaos and centralizing requests. | Ticket Volume, First Response Time. | Agent utilization, Cost per ticket. |
| Managed (Processes in place) | Consistency, basic SLAs, and user satisfaction. | FRT, ART, CSAT, SLA Breach Rate. | Deep problem management analytics. |
| Proactive (Optimizing workflows) | Preventing issues and automating resolutions. | Deflection Rate, Auto-Resolution Rate, CSAT. | Metrics that punish agents for taking on complex, long-running tickets. |
Common Mistakes: What NOT to Measure
It is incredibly easy to weaponize metrics against your own team. Tracking the wrong numbers creates perverse incentives that destroy morale and degrade the quality of IT support. Never track "Tickets Closed Per Agent" as a primary performance indicator. If technicians know they are judged purely on volume, they will cherry-pick the easiest, fastest tickets—like simple password resets—and leave complex, time-consuming networking issues rotting in the queue. This destroys your Average Resolution Time for critical issues.
Similarly, do not obsess over the "Reopen Rate" without context. A low reopen rate looks great on paper, but it often means technicians are aggressively closing tickets before the user has confirmed the issue is actually resolved. The user then has to submit an entirely new ticket, which artificially inflates your total ticket volume and frustrates the employee. Focus on the qualitative feedback in your CSAT surveys rather than using crude volume metrics to judge individual technician performance.
How Tooling and Pricing Models Distort Metric Tracking
Your ability to track accurate metrics is heavily influenced by the software you use and how you pay for it. Many legacy service desks charge per agent seat. This licensing model forces small companies into bad habits. To save money, an IT manager might only buy two agent licenses, forcing the HR or Facilities teams to work outside the system or share logins. When multiple people share an agent account, your audit logs and individual performance metrics are completely ruined.
Instead of limiting access based on per-seat licenses, look for systems that offer flat monthly pricing per workspace. When you are not penalized financially for adding a new technician or bringing the operations team into the helpdesk, you capture all internal requests in a single system. This unified approach provides a genuine, unfragmented view of your company's operational bottlenecks, ensuring your ticket volume and resolution metrics reflect reality rather than a budget constraint.
Tracking the right helpdesk metrics gives your small IT team the visibility it needs to stop fighting fires and start improving the employee experience. You need a system that structures this data automatically without forcing your technicians to act as data-entry clerks. If you are ready to implement an AI-first internal service desk built specifically for SMEs—with intelligent routing, agentic auto-resolution, and clear reporting out of the box—try QueueDesk today and get your operational data under control.
Get started today
Ready to fix internal support?
Free Starter plan. No credit card. Up and running the same day.
Start freeFrequently asked questions
How often should a small IT team review their core helpdesk metrics?+
A small IT team should perform a high-level review of their core metrics (FRT, ART, CSAT, and Volume) once a month. Reviewing them daily or weekly creates unnecessary anxiety over minor fluctuations, while waiting for a quarterly review allows bad trends to become permanent habits.
What is considered a good Customer Satisfaction (CSAT) score for internal IT?+
For internal IT support, a healthy CSAT score typically sits between 90% and 95%. Anything consistently below 85% indicates a systemic issue with communication or resolution quality. A perfect 100% is often a warning sign that dissatisfied users simply aren't filling out the surveys.
Should we track SLA metrics differently for executives or VIP users?+
Yes, many small teams use VIP tagging to apply stricter Service Level Agreements to executives or critical personnel. However, this should be handled automatically via routing rules rather than relying on agents to notice a VIP name. Just ensure VIP requests don't entirely derail support for the rest of the company.
How do we measure the actual ROI of our internal Knowledge Base?+
The simplest way to measure Knowledge Base ROI is to track the Ticket Deflection Rate alongside search queries that result in zero tickets created. If an employee searches for 'VPN setup,' views the article, and closes the portal without opening a ticket, that counts as a successful deflection.